How Many Homes Are For Sale in Austin Right Now?
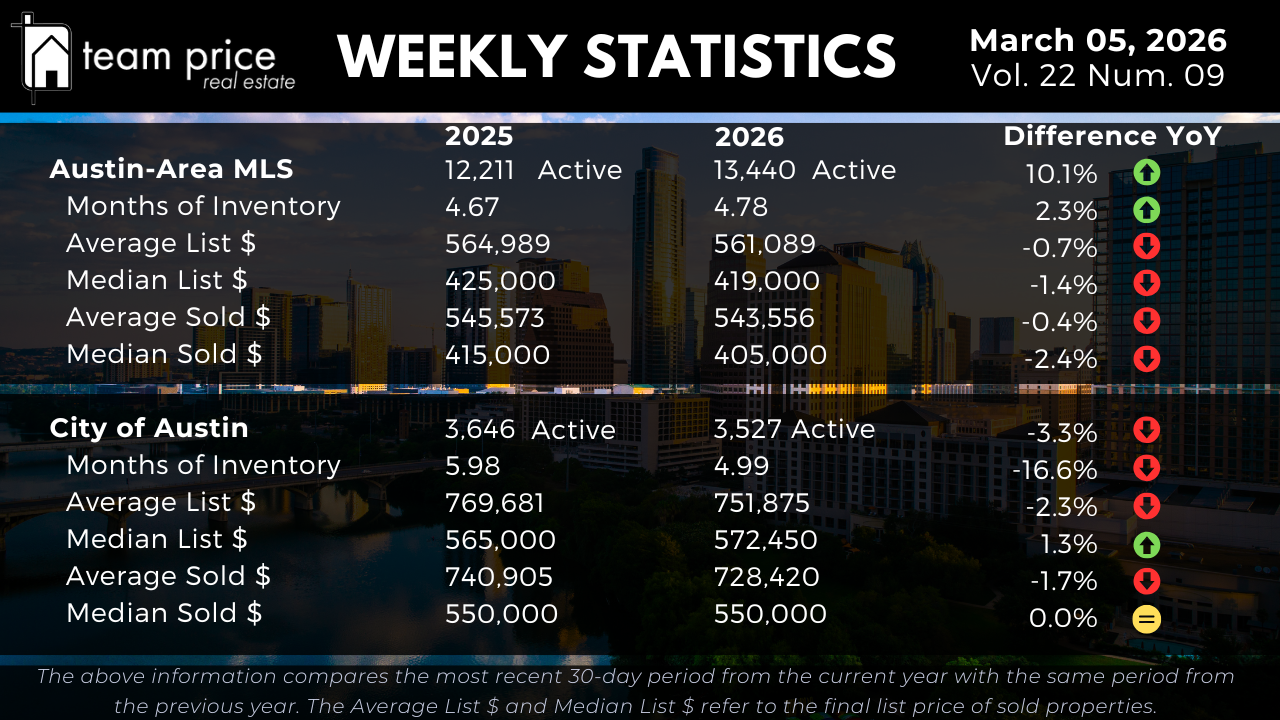
There are currently 13,440 active residential listings across the Austin-Area MLS as of March 5, 2026. That is up from 12,211 at this same point last year, an increase of 1,229 homes or 10.1% year over year. For context, the Austin market reached a prior inventory peak of approximately 18,146 listings in June 2025, meaning the current level sits well below that high-water mark. The market is still carrying more supply than historical norms support, but the acute oversupply that defined the summer of 2025 has meaningfully receded.
Months of Inventory currently stands at 4.78 months, compared to 4.67 months one year ago, a 2.3% increase. That figure places the market in balanced-to-buyer-leaning territory. Below three months typically signals seller advantage; above six months signals buyer dominance. At 4.78 months, buyers hold a real negotiating edge, but the market is not in distress. Importantly, the pace of inventory growth has moderated considerably. Earlier in 2026, year-over-year inventory increases were running as high as 12.7%. The current 10.1% gap is still elevated but is narrowing — a directional shift that deserves attention as the spring buying season takes shape.
Inside the City of Austin, the inventory picture is fundamentally different. Active listings have declined from 3,646 to 3,527, a 3.3% year-over-year decrease. Even more significant, Months of Inventory inside the city has dropped from 5.98 to 4.99 months — an improvement of 16.6% — meaning Austin proper is now absorbing available homes more efficiently than it was a year ago. The city has gone from being more oversupplied than the broader metro to now carrying slightly less supply. That is a structural shift, not a temporary blip, and sellers in core Austin zip codes are operating in a materially more competitive environment than those in the outer suburbs.
Are Austin Home Prices Going Up or Down in March 2026?
Austin home prices across the Greater Austin housing market are modestly lower year over year, but the pace of decline has slowed significantly compared to prior periods. The average active list price currently stands at $561,089, down 0.7% from $564,989 one year ago. The median active list price has moved from $425,000 to $419,000, a year-over-year decline of 1.4%. Sellers are pricing more competitively than twelve months ago, but the sharp corrections that defined 2022 through 2024 are no longer the dominant pattern. Price adjustments are becoming smaller and more measured.
On the closed sales side, the average sold price stands at $543,556, down 0.4% from $545,573 last year. The median sold price has declined from $415,000 to $405,000, a drop of 2.4% year over year. The median's 2.4% decline is the largest of the four pricing metrics tracked this week, confirming that buyers in the mid-market price range are extracting the most negotiating traction. When averages and medians decline together — as they are doing here — it reflects broad-based softening rather than an outlier effect at either end of the price spectrum. Week over week, list prices are largely flat entering March, consistent with seasonal patterns as spring demand begins to build.
What Are Home Prices Doing Inside the City of Austin?
Home prices inside the City of Austin are showing a more stable profile than the broader Austin metro, and in one key metric, they are moving higher. The average active list price in the city has declined from $769,681 to $751,875, a year-over-year decrease of 2.3%. However, the median active list price has moved in the opposite direction — up from $565,000 to $572,450, a gain of 1.3% year over year. That divergence between a lower average and a higher median indicates compression at the upper end of the city market, while mid-tier pricing holds firm or edges higher.
Closed sale data tells a similar story. The average sold price inside the City of Austin has declined from $740,905 to $728,420, down 1.7% year over year. The median sold price has held at exactly $550,000, unchanged from one year ago. A flat median sold price inside the City of Austin stands out against a backdrop where the broader metro median has declined 2.4%. That stability, combined with a 16.6% improvement in Months of Inventory, tells us the City of Austin is the closest it has been to pricing equilibrium in several years. It is not generating the kind of tight conditions that would push prices materially higher, but the floor is holding in a way that the outer suburban markets cannot currently claim.
Buyer Leverage and Negotiation: What the Numbers Say
Negotiation remains a defining feature of the Central Texas real estate market entering spring 2026. So far this month, 68.54% of all closed sales across the Austin-Area MLS have sold below list price. That compares to 70.14% last month, meaning a slightly smaller share of homes are closing under asking price than in February — a subtle but measurable improvement for sellers. At the same time, 20.29% of homes have sold at list price, essentially flat compared to last month's 20.32%. Properties that sold above list price account for 11.16% of transactions this month, up from 9.54% last month, and just below the 12.08% recorded in February 2025.
The average sold-to-list price ratio stands at 97.08%, meaning sellers are accepting just under 3% below asking price on average at closing. This figure has been consistent over recent months and confirms that concessions remain common across most price ranges. The month-over-month uptick in above-list-price sales — from 9.54% to 11.16% — is worth noting as the market enters its busiest season. It may reflect early spring demand beginning to absorb well-priced inventory at a faster pace. One month is not a trend, but the directional movement is real. Buyers still hold clear leverage across the majority of transactions, and that is unlikely to change dramatically while inventory remains near 4.78 months of supply.
How Is the Austin Real Estate Market Performing City by City and ZIP Code by ZIP Code?
Market performance across the 30 cities tracked in Central Texas remains uneven, and that unevenness is one of the defining characteristics of Austin TX real estate in 2026. On a month-over-month basis, 19 cities — or 63% — have recorded price increases, while 11 have declined. That short-term split is encouraging on the surface. Year over year, however, the picture is more divided: 12 cities or 40% are above prior-year pricing, while 18 cities or 60% remain lower than they were at this time in 2025. When each city is measured against its own 12-month peak, not a single one of the 30 cities has surpassed its prior high. All 30 remain below peak pricing levels.
The pattern that explains much of this dispersion is geography and construction activity. Outer suburban markets with active new construction pipelines — including several cities in Williamson and Hays counties — are carrying the heaviest inventory loads and the most pricing pressure. The inner ring and urban core, where new construction is more constrained, are showing greater relative stability. The City of Austin, as noted, stands as the clearest example of that inner-market dynamic, with declining inventory, improving absorption, and a flat median sold price.
At the ZIP code level, the data shows 45 of 75 tracked ZIP codes — 60% — recorded month-over-month price gains, while 30 declined. Year over year, 33 ZIP codes or 44% are above prior-year levels, and 42 or 56% are still lower. When measured from 12-month peak pricing, only 1 of 75 ZIP codes has exceeded its prior high, while 74 remain below peak. Short-term stabilization in the majority of ZIP codes is real, but it has not yet translated into broad year-over-year recovery across the region. The Austin real estate market in 2026 is hyperlocal, and broad averages mask a wide range of individual neighborhood outcomes.
How Far Have Austin Home Prices Fallen From Their Peak?
Austin home prices remain materially below the highs set in 2022 and early 2023, and understanding those gaps is essential for setting accurate pricing expectations today. Across the Austin-Area MLS, the average list price peaked in March 2023 at $708,929 and currently stands at $671,664, a decline of $37,265 or approximately 5.3%. The median list price peaked in May 2022 at $539,900 and now stands at $449,900, down $90,000 or approximately 16.7% from peak.
On the sold side, the average sold price peaked at $664,515 in May 2022 and is currently $537,577, a drop of $126,938 or approximately 19.1%. The median sold price peaked at $538,000 in May 2022 and now stands at $402,503, a decline of $135,497 or approximately 25.2% from peak. Price per square foot metrics underscore the same story: the average sold price per square foot has declined from a peak of $324 to a current $240, down $84 or 25.9%; the median sold price per square foot has fallen from $280 to $201, down $79 or 28.2%.
Inside the City of Austin, peak-to-current comparisons carry their own distinct pattern. The average list price peaked more recently — September 2025 at $959,298 — and currently stands at $923,061, a decline of $36,237 or approximately 3.8%. The city's median list price peaked in May 2022 at $658,589 and now stands at $600,000, down $58,589 or approximately 8.9%. The average sold price in the city peaked at $847,583 in May 2022 and is currently $718,175, a decrease of $129,408 or approximately 15.3%. The median sold price peaked at $680,000 and now stands at $540,000, a decline of $140,000 or approximately 20.6%. At the price-per-square-foot level, the average has dropped from a peak of $442 to $325, down $117 or approximately 26.5%. The median has declined from a peak of $393 to $283, a decrease of $110 or approximately 28.0%.
Austin Housing Market Outlook: What Spring 2026 Brings for Buyers and Sellers
As the Austin housing market moves into March 2026 and the traditional spring selling season, the data is pointing toward continued normalization rather than acceleration in either direction. Inventory across the broader metro is still elevated year over year, but the rate of growth has moderated from the sharp increases seen earlier in the correction cycle. The City of Austin is absorbing supply more efficiently than it was a year ago. Short-term month-over-month price gains are now visible in 63% of cities and 60% of ZIP codes tracked — a stabilization pattern that was not present during the more volatile phases of 2023 and 2024. Price declines are still a year-over-year reality, but they are smaller and slower than they were.
For buyers in the Austin metro, this spring provides a combination of conditions that has not been available in years: broad selection, real negotiating leverage, prices that are 20% to 25% below 2022 peaks at the median level, and a market that is not generating the urgency-driven bidding competition that defined the pandemic era. Buyers who approach the market with current data and realistic pricing anchors are finding genuine opportunity across the region. For sellers, this market rewards one thing above all others: pricing accuracy from day one. Nearly 48% of all active listings across the Austin-Area MLS have already had at least one price reduction. Homes priced in line with current absorption absorb. Homes priced against peak expectations sit and accumulate days on market, which weakens negotiating position over time. In the City of Austin, where the structural backdrop is more supportive, sellers have more room to hold. In the outer suburbs, where new construction continues to compete for the same buyer pool, that room is considerably narrower.